
BUSMASTER 3.2.2.45 adds LIN and XCP signal graphs
BUSMASTER 3.2.2.45 introduces signal graphs for LIN and XCP. Engineers can follow lighting, position, temperature and internal ECU variables over time, making trends and unexpected changes easier to identify.
Plot LIN signals from an LDF
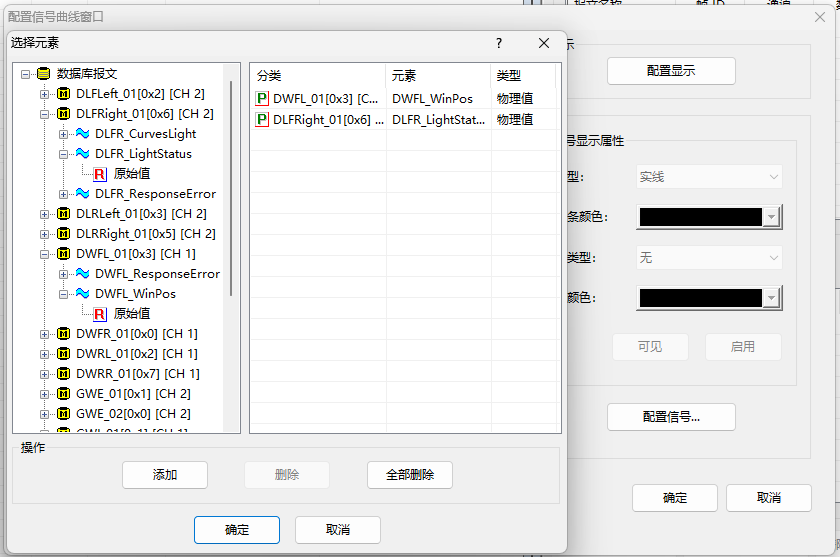
Section titled “Plot LIN signals from an LDF”Load an LDF, select database signals in the LIN signal-graph window, and add them to the element list. The graph can display raw or physical values and is saved with the workspace. CAN and LIN maintain their own signal and graph settings.
Follow XCP variables alongside bus signals
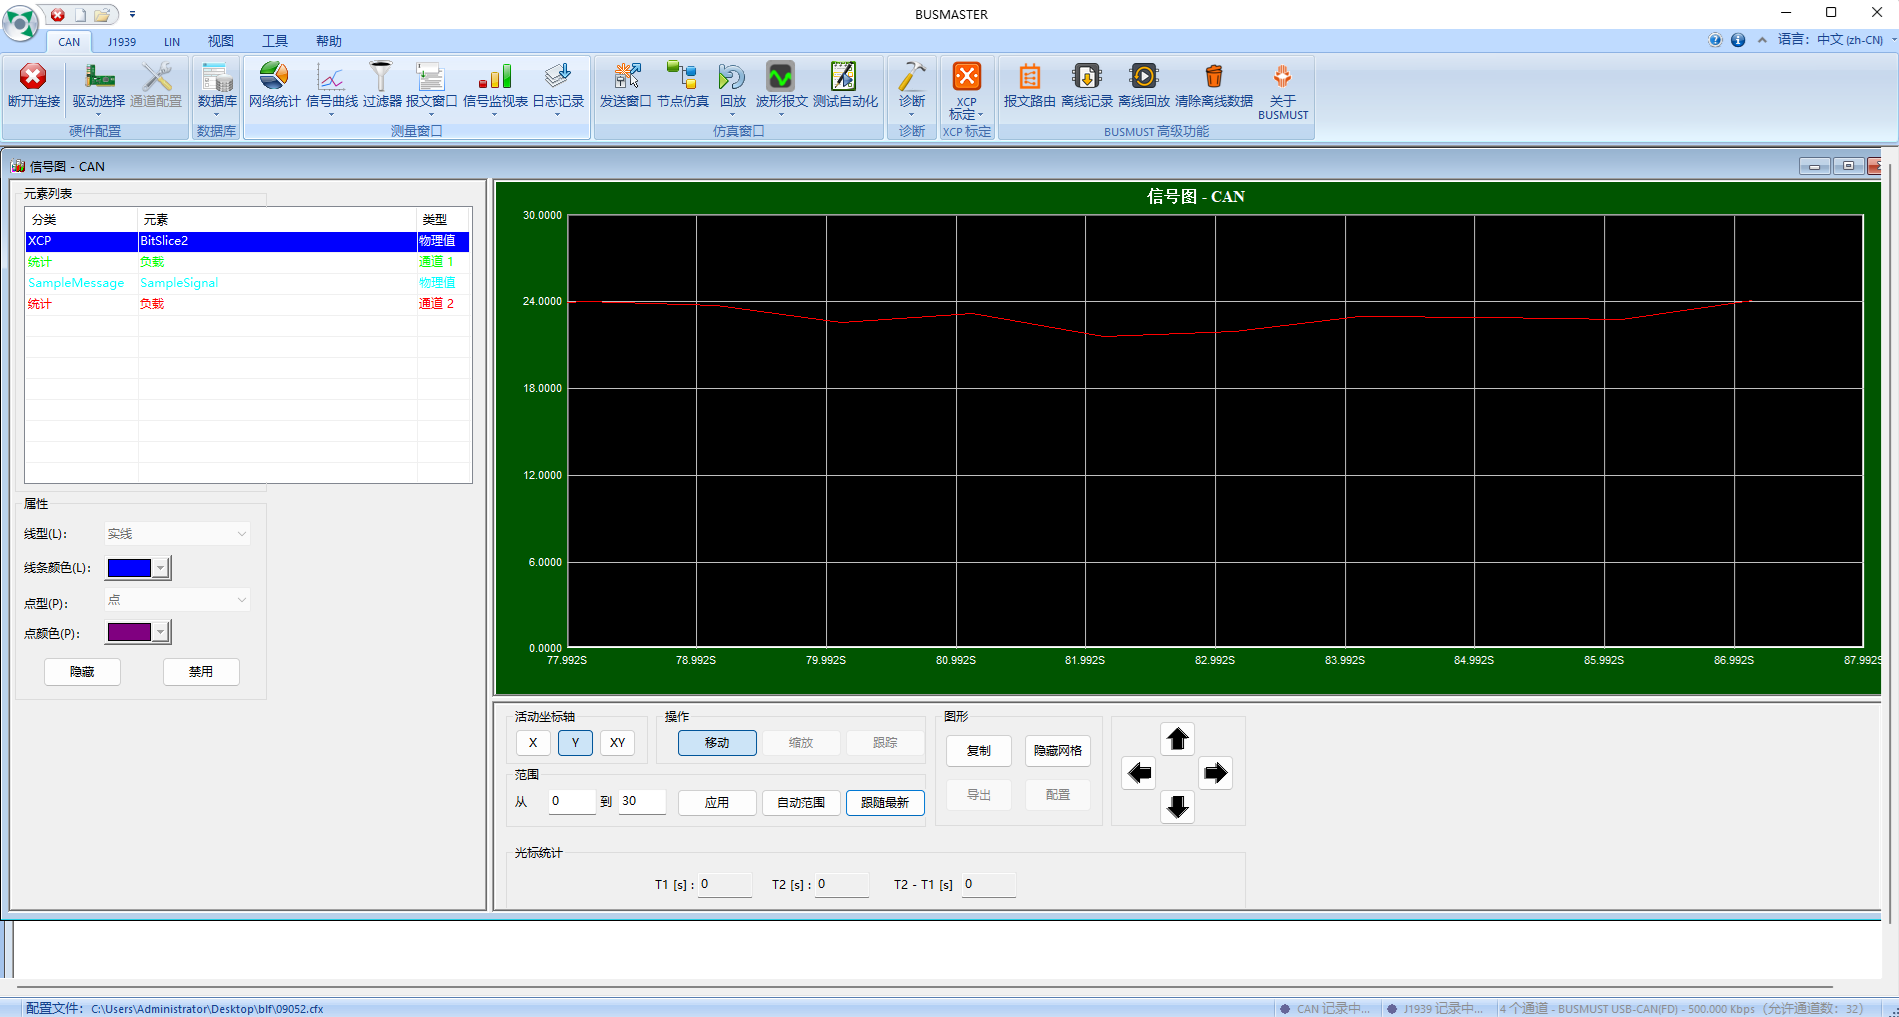
Section titled “Follow XCP variables alongside bus signals”After adding A2L measurement or calibration variables to the working set, add their physical values to the CAN signal graph. Comparing these curves with bus signals helps relate a command to the ECU state that follows it.
This release also improves reconnection after local or remote devices disconnect, window positioning, and workspace-saving stability.