
Signal Graph
Graph Support for CAN, LIN, XCP, and Statistics
Section titled “Graph Support for CAN, LIN, XCP, and Statistics”BUSMASTER Signal Graph plots raw or physical database signals, CAN network statistics, LIN signals from an imported LDF, and physical XCP measurements from the current XCP workset. Up to 10 elements can be configured in one graph. Each element can use its own line, color, and sample-point symbol. Move, zoom, track, cursors, and export tools support offline analysis of the captured samples.
Starting With Graph
Section titled “Starting With Graph”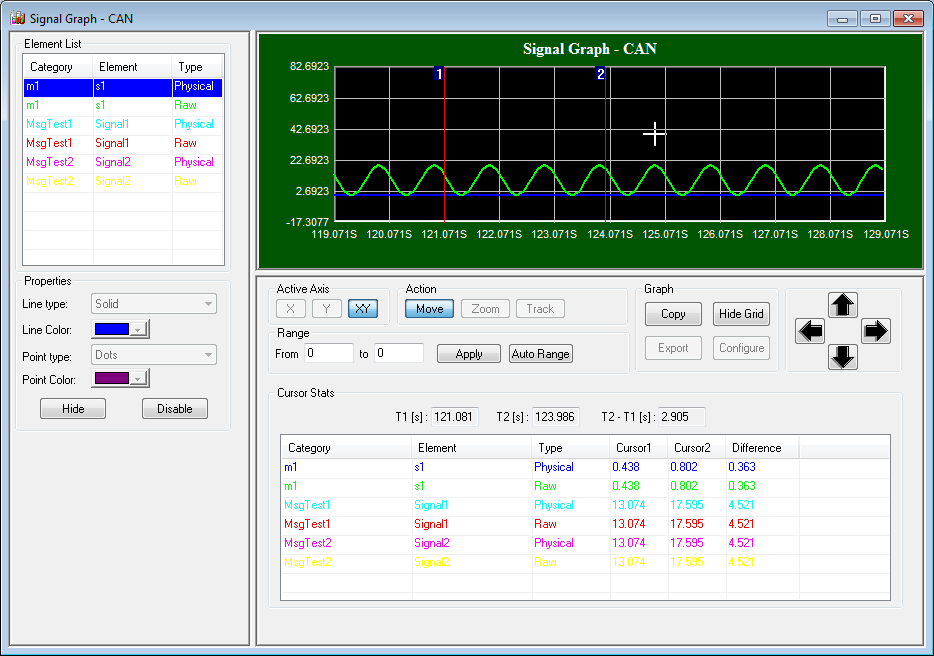
For CAN database signals, statistics, and XCP measurements, select CAN –> Signal Graph –> Activate. For LIN signals, select LIN –> Signal Graph –> Activate. The left pane lists the configured elements and their properties, including line type and color, sample-point symbol and color, visibility, and enabled state. Use Configure to change the element list.
The right side view shows graph window. Below that controls are provided that will manipulate plotted graph. These ranges from basic manipulation of graph like moving, zooming and tracking the value. Advanced features like setting scale values automatically, setting all graph elements one below another and setting manual range. For easy navigation directional navigation keys are provided which will move the graph in the selected direction by one grid position.
Graph control shall be configured in terms of performance and view style. Graph buffer size and update rate can be configured by the user to optimize the performance. Graph window view style shall be fully configured by the user including colors of various graph window components. User shall configure the graph window to his known style like oscilloscope or Excel graph.
Data from graph buffer shall be exported in various formats. This includes exporting data as image, CSV used in excel and detailed HTML report. HTML report shall be printed after creation by BUSMASTER. This report shall be modified by the user after create using any HTML editor externally. This report will include graph elements detail like range, unit, color and min-max values.
Configuring Graph
Section titled “Configuring Graph”To configure graph for a particular bus with graph elements or statistics elements select CAN –> signal Graph –> Configure menu item. This will show Configure Signal Graph Window dialog.
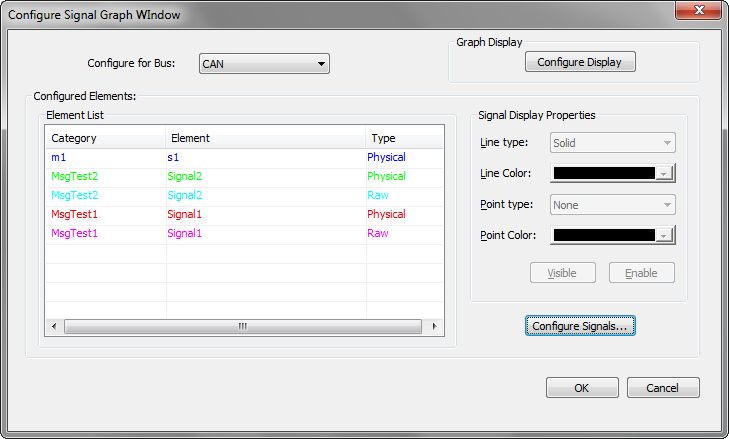
Select the bus name from the combo box for which you wish to configure graph elements data.
Click the ‘Configure …’ button in the Configured Elements: group box shown in the above dialog. Element Selection dialog will be shown.
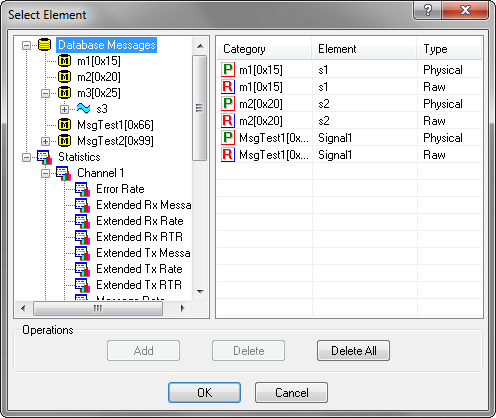
This dialog will show list of database message-signals and statistics parameters. Each signal will have physical and raw value entries. As soon as a signal value (physical or raw or both) is added in to the list that will be removed from the tree. To add an item, select the item (Physical or Raw value of signal or statistics parameters only) from tree and select Add button. This will add the item in to element list and will remove the item from tree.
Note: To add an item quickly, just double click the item. After an element addition element color and sample point type are automatically assigned. Only 10 elements are allowed to add. If elements count exceeds 10 the Add button will be disabled and double clicking the item will show error message.
To delete an item from the element list, select the item from the element list right side and select Delete button. This will remove the selected item from element list and will put the deleted item in to the tree at the appropriate place.
To delete all item from the element list select Delete All button. This will cleat element list and will refresh tree to include all database messages and statistics parameters.
Note: To view details of a database signal just double click the item from element list. This will popup signal details dialog with signal definition. Selecting OK will save changes and will close element selection dialog . To undo changes done in element selection dialog just select Cancel button. This will ignore all changes done by the user.
Configure a LIN signal graph
Section titled “Configure a LIN signal graph”Import the required LDF and make sure the message is assigned to the intended LIN channel. Open LIN –> Signal Graph –> Configure, click Configure Signals…, and expand Database Messages. Expand the message and signal, then add either Raw or Physical.
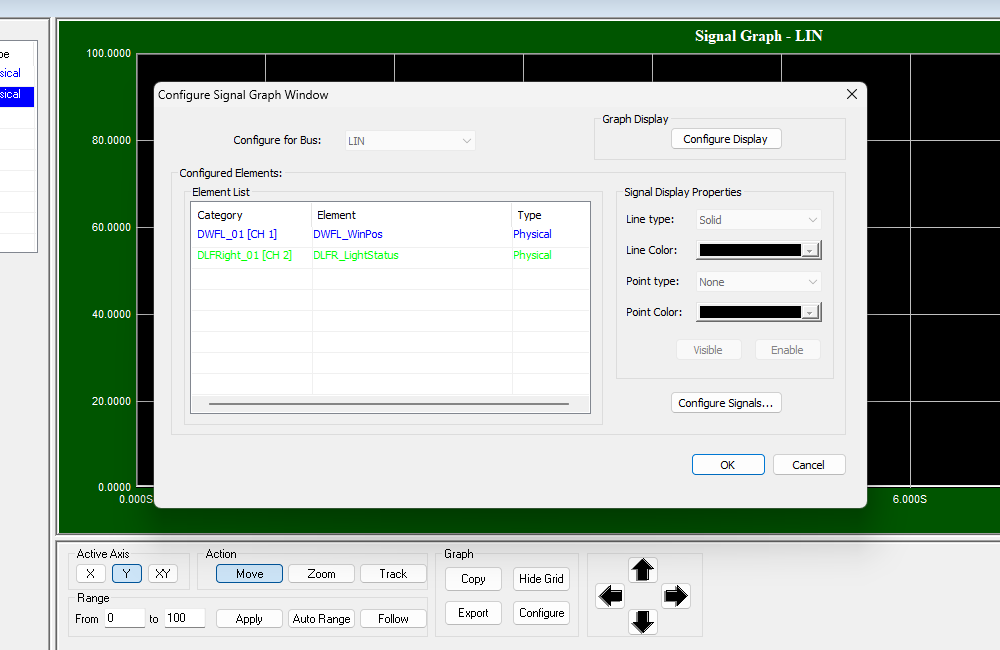
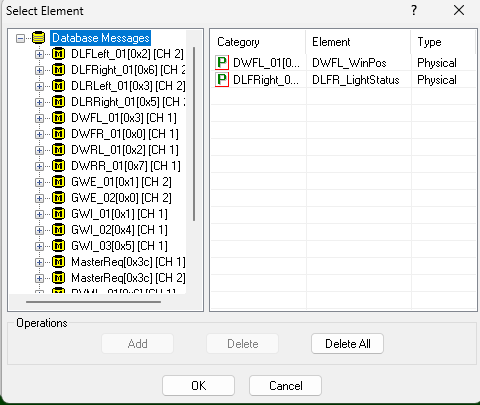
- Select the message and signal under Database Messages.
- Verify the configured list contains the correct message category, signal name, and Raw or Physical type.
- Use Add or double-click the value leaf, then click OK.
Connect LIN to begin receiving samples. Physical elements use the LDF conversion; Raw elements show the encoded signal value.
Configure an XCP measurement graph
Section titled “Configure an XCP measurement graph”Load the ECU A2L, add the required scalar MEASUREMENT objects to the XCP workset, and check their Acquire boxes. In CAN –> Signal Graph –> Configure, click Configure Signals…, expand XCP, the MODULE, and the measurement, then add its Physical value.
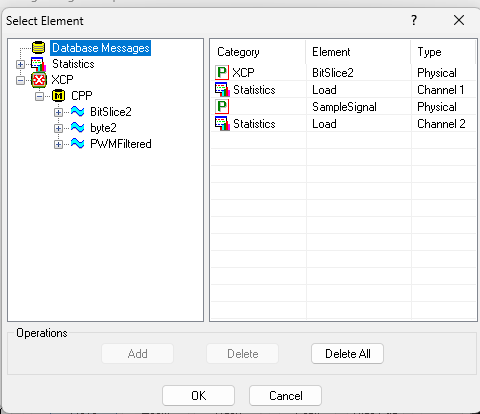 Connect Host CAN and XCP and start acquisition. The graph samples the latest physical value published by the XCP workset. See XCP Main Window for the complete workflow.
Graph Element List
Section titled “Graph Element List”The graph element list will be shown in left side view of graph window. This will show element name, category and value type. For a database signal this will show signal name, message name and value type. For statistics parameters this will show parameter name. Each element will be displayed in the color of that graph element. Selecting an element will update the element properties below the list.
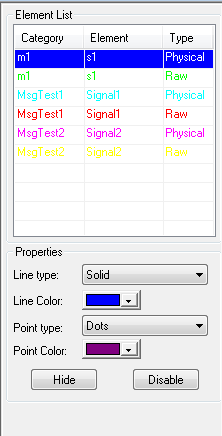
Select a list item to see the element details and to modify the details. The selected item will be highlighted in the graph using bold solid line. Various line styles and point styles are supported by BUSMASTER. Sample points symbols will be drawn only if the tool is in disconnected state. When to tool is connected, the graph will go to tailored mode or run mode where cosmetic components of the graph will not be drawn.
Line Type
Section titled “Line Type”BUSMASTER graph supports various types of lines ranging for different line styles to different line types. The following is the list of supported line types.
Solid - Graph with solid line Dashed - Graph with Dashed lines Dotted - Graph with Dotted lines Dash-Dot - Graph with Dashed and Dotted lines Dash - Dot - Dotted - Graph with Dash followed by a Dot followed by a Dotted line.
Line Color
Section titled “Line Color”Color of the graph line. User can select standard colors from the palette or user can define own color from the RGB and illumination space.
Point Type
Section titled “Point Type”Type of the sample point element. User can select sample point symbols to highlight the points at which graph got samples. This will be disabled by selecting point type as NONE. BUSMASTER supports following symbol types.
None ( To Disable Sample point Symbols ) Dots Rectangles Diamonds Asterics Down Triangles Up Triangles Left Triangles Right Triangles
Point Color
Section titled “Point Color”Color of the sample point symbol. User can select standard colors from the palette or user can define own color from the RGB and illumination space.
Show/Hide
Section titled “Show/Hide”This is to show or hide a graph from graph window. The hidden graphs will not be plotted in graph window. But a hidden graph will receive samples if the tool is connected. User can be able to view the hidden graph at any point of time. This is to hide the graph from drawing.
Enable/Disable
Section titled “Enable/Disable”This is to enable or disable a graph element from receiving sample values. If a graph is disabled it will not receive any update for message/signals or statistics parameters. This is to avoid a graph getting samples from message/signals or statistics parameters. If the tool is connected and a graph element is disabled, it will not get latest values. If it is enabled again it will start getting latest values. Changing the enable property will reflect only if the tool is connected.
Note: Due to highlight, the line style modification will not be visible during selection. This will be visible if the selection moves to other element Disable is a run time option. This will be considered only if the tool is connected and message activity is on.
Graph Manipulation Controls
Section titled “Graph Manipulation Controls”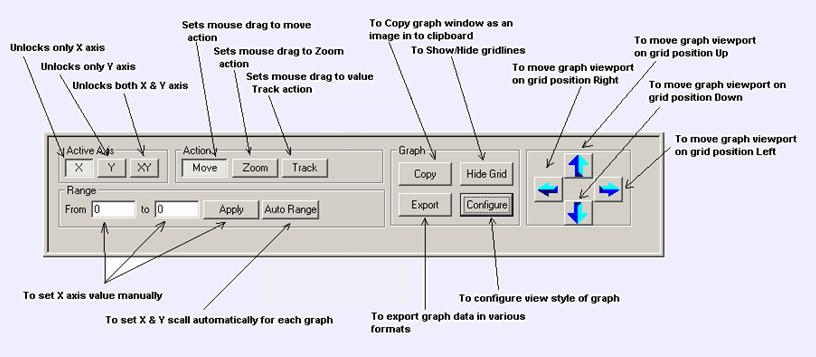
Active Axis
Section titled “Active Axis”This unlocks mouse move only in the enabled axis. If X axis is selected only X axis value of mouse movement will be taken in to account. The behavior is same for Y axis too. If XY is selected then axis local will be removed and both X and Y will be considered for the action specified in the Action frame.
Action
Section titled “Action”This setting will be taken during mouse drag. Action MOVE will move the graph while dragging the mouse in graph window. If ZOOM is selected the mouse drag will result in zooming the graph. TRACK will show the value at mouse cursor point in terms of selected element Y axis and X time axis values. The actions zoom and move are combined with active axis. If action is MOVE and active axis is X then mouse drag will move the graph only in X Axis. Similarly if action is ZOOM and active axis is X then mouse drag will zoom the graph only in X Axis (time scale zooming). Track will work independent of active axis. It will show both X and Y value of mouse point. This will freeze the graph from mouse drag actions and XY scale will remain same.
To set time axis value for all graphs this range option is given. This has inputs from and to. This will be the time axis min and max values. Valid time scale value shall be set by selecting the button Apply. Apply will validate time entered time scale value and will set the X axis time value. Decimal values could be entered to see the graph more closely.
From 1 To 10 (Sec) From 2.23 To 2.24 (Sec)
Auto Range
Section titled “Auto Range”To set optimal values for time axis and Y scale for all graphs auto range option is given. This will find the min and max time value to set optimal X Axis value. Each graph will set its own Y axis value such that the graph will occupy whole graph window. All graphs will overlap each other as each graph is utilizing whole graph window. This mode will be useful to find the overlapping between the signal values or to compare value of various signals and statistics parameters.
Auto Fit
Section titled “Auto Fit”To set optimal values for time axis and Y scale will set to a value such that each graph will be displayed one by one. This will be useful to find all graphs with out any overlap. All graph elements will occupy portion of graph window so that its element value will not merge with other graph element. The whole graph area will be shared across all graph elements.
Cursors for Signal Tracking
Section titled “Cursors for Signal Tracking”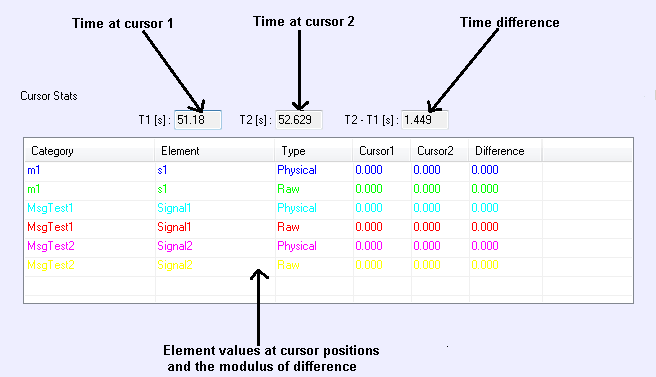
Description
Section titled “Description”Cursors for Signal tracking is an offline feature available for viewing the element values at different time values.
Cursors can be activated by left mouse double clicks on the graph. When the two cursors are activated, user can view the time values at respective cursor postions and the element values in the bottom view of the graph as shown in the above figure.
User can deactivate the cursors by right mouse double click on the graph.
The time values at cursors are shown in a read only edit boxes. The list box shown in the above figure presents the interpolated element values at both the cursor positions and the modulus of difference between both the values.
Track Mode
Section titled “Track Mode”Track mode is activated by clicking the Track button in Actions group of Graph manipulations controls.
In this mode, user can drag the cursors to new time values. For this user has to position the mouse on the cursor which is to be dragged to a new position. Then keep holding the left mouse and drag the cursor to new position.
The image below shows the dragging of cursor to new time value.
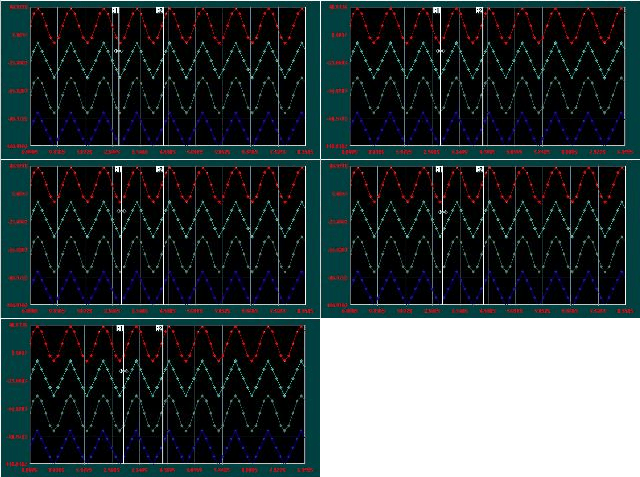
If the user wants to clear the cursors on the graph at any point of time, right mouse double click will do the job.
Graph Window Configuration
Section titled “Graph Window Configuration”To change look and feel of graph select Configure button from right side view of graph window. This will popup graph configuration dialog. This dialog has various graph view style parameters.
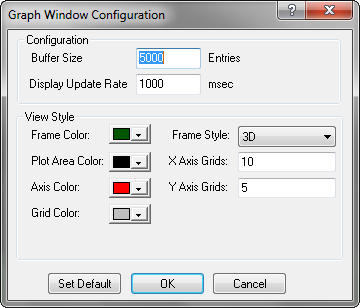
Buffer Size
Section titled “Buffer Size”User can configure graph buffer size in terms of number of entries in the graph. Buffer will be created with this size for each graph elements in the graph. If the graph has two message signals and two statistics signals and the buffer size is 10000 entries, each element can hold 10000 entries and individual buffers will be created to hold 10000 samples. Once the buffer will become full old data will be removed to make room for latest data. For optimal performance of the tool keep this buffer size minimum or with the default value. The supported value for this parameter is between 1000 - 50000 entries.
Display Update Rate
Section titled “Display Update Rate”This is the cyclic time delay after which the display will be updated. This refresh timer delay will be set to this value. The default value is 1000 msec or one second. The supported value for this parameter is between 1000 - 20000 millisecond.
Frame Color
Section titled “Frame Color”This is the color of the Frame. Frame is the rectangle area that covers the graph plotting area. This parameter depends on the frame style also. This color will be considered only for frame styles FLAT and SCOPE. Selecting this button will popup a dialog where standard colors will be displayed. There will be an option to give custom RGB values also.
Plot Area Color
Section titled “Plot Area Color”This is the color of graph elements plotting area. This forms the background of the graph area.
Axis Color
Section titled “Axis Color”This is the color of axis rectangle. Axis rectangle is visible only if the frame style is flat. Other wise this rectangle will be hidden by 3D border of the frame.
Grid Color
Section titled “Grid Color”This is the color of grid lines. This change will be visible only if grid lines are visible.
Frame Style
Section titled “Frame Style”Three types of frame styles are supported. FLAT, 3D and FRAME. In flat style axis rectangle will cover graph plotting area. This is a flat rectangle. In 3D style a 3D rectangle will cover graph plotting area. Axis rectangle will be in 3D format. In FRAME style a gradient picture will be used to cover plotting area.
Grid Lines
Section titled “Grid Lines”This will configure number of grid lines displayed on X and Y axis. Supported range is 2 - 10. The grid line starts from left to right in case of X axis. The last grid line will merge with right side boundary. For Y axis grid lines will start from bottom to top. The last Y axis grid will merge with top boundary of the graph.
Line Display
Section titled “Line Display”This will configure line display style of grid lines displayed on X and Y axis. Currently three styles of display are supported for graph drawing. They Normal , Step Mode XY (Graph will be advanced in X axis first and then in Y Axis.) and Step Mode YX (Graph will be advanced in Y axis first and then in X Axis.).
Set Default
Section titled “Set Default”This will set all parameters to default values. View style parameters will be set to default color and style. Buffer size will be set to 10000 entries and display update rate will be set to 1000 msec.
Note: All graph window configuration parameters are saved in BUSMASTER configuration file. While loading a configuration file all are restored.
Graph Export
Section titled “Graph Export”BUSMASTER graph shall be exported in several types. These are Comma Separated Format or CSV, detailed HTML report and as a bitmap picture. In CSV export graph element details are exported with corresponding time values.
To make extensive test report HTML format will be handy. This will generate a report in HTML format with graph and elements details. The same shall be printed directly from BUSMASTER if Print option is enabled.
To save the graph window details as image, image export option is given. This will save the graph windows snapshot in to the specified bitmap file.
Note: CSV export will export only the data that is currently in element buffer of the graph. HTML report will take the snapshot of the graph window. This will not modify either time range or y axis appearence. User has freedom to set any time range and Y axis range. This should be done before exporting the report. To optimise printing, select light plot area color. This will make background of the graph lighter and elements can be easily identified. Select Landscape as page format to fit whole report in one page.
Authoritative source: BUSMASTER DITA help source signal_graph.dita, compiled into BUSMASTER.CHM with the application.